loader
banner

End-to-end data pipeline & Power BI dashboards for a retailer

Executive Summary

A retail client selling fashion, cosmetics, home goods, grocery and more asked us to solve one problem: their teams could not get timely, trustworthy retail reports — sell-through, stock balances, fast-movers, location-wise sales, hourly turnover, YoY comparisons, sales efficiency and even real-time website visits. We built an end-to-end real-time data pipeline (POS, WMS/warehouse, OMS, website analytics, ERP and other systems → analytics), delivered role-specific Power BI dashboards and embedded operational alerts. The result: fast, trusted decisions for controllers, merchandisers, warehouse, finance, logistics, HR and senior management.

Executive Summary Visual

The Business Challenge

Retailers today need to make near-instant inventory and merchandising decisions. Our client faced:

  • Fragmented data across POS, warehouse, order management, ERP and website analytics.
  • No single source-of-truth for sell-through, stock balances or fast movers.
  • Difficulty comparing current performance with last year or prior periods.
  • No real-time view of online traffic and conversions.
  • Multiple stakeholders (controllers, merchandisers, ops, finance, senior management) needing tailored KPIs and dashboards.
  • Manual, slow reporting that led to missed replenishments, overstocks and lost sales opportunities.

High-Level Architecture

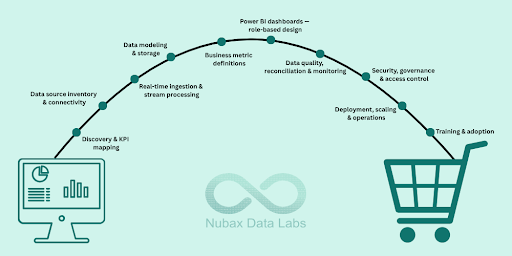
Sources (POS, WMS, OMS, ERP, Website Analytics) → Stream ingestion (event connectors) → Stream processing (enrichment, dedupe, business rules) → Curated storage (time-series facts, dimension tables, snapshots) → Serving layer (analytics marts / materialized views) → Power BI dashboards + alerting.

Solution overview — what we delivered

We designed and implemented a production-grade, real-time retail analytics platform and Power BI reporting layer that:

  • Ingests events and snapshots from POS, Warehouse Management System (WMS), Order Management System (OMS), ERP and website analytics in real time.
  • Performs stream processing to enrich, deduplicate and compute key metrics on the fly.
  • Persists raw and curated data to a central analytics store and materialized marts optimized for Power BI.
  • Exposes role-based Power BI dashboards (controllers, merchandisers, warehouse, finance, logistics, HR, senior management, store teams) with drilldowns, historical comparisons and alerts.
  • Implements data quality, lineage, security and operational monitoring.
Solution Overview Visual

Step-by-Step: How We Built It

1. Discovery & KPI Mapping

We started with stakeholder workshops to map the KPIs each team needed and the required data freshness (real-time, sub-minute, hourly, daily). Output: KPI catalog (sell-through, stock balances, fast-movers, hourly sales, turnover, YoY variants, website visits, conversion, sales efficiency) and a persona map defining each dashboard’s needs.

2. Data Source Inventory & Connectivity

We cataloged systems and data elements required:

  • POS: transactions, SKUs, store ID, timestamp, payment type, cashier.
  • WMS: on-hand, receipts, movements, lot/batch info.
  • OMS: order lifecycle events and fulfillment status.
  • ERP: purchase orders, goods receipt, costs, finance mappings.
  • Website analytics: sessions, pageviews, events, conversions (real time).
  • Master data: product catalog, store locations, pricing, promotions.
Project Image

For each source we implemented connectors that stream events (and scheduled snapshot extracts where streaming was not available). Connectors include idempotency and high-water marks for robust replay and recovery.

3. Real-time Ingestion & Stream Processing

Incoming events are normalized and routed through a stream processing layer where we:

  • Standardize timestamps (local store timezone).
  • Deduplicate (idempotent writes using unique event IDs).
  • Enrich events (join product master, store metadata).
  • Apply business rules (returns handling, cancelled orders, promotion attribution).
  • Compute real-time aggregates (e.g., per-hour rolling totals, session → order join for conversion).

This layer is where near-real-time KPIs are computed and published to the serving store.

4. Data Modeling & Storage

We persist:

  • Raw zone: immutable event store (for replay and audit).
  • Staging/curated zone: cleaned, canonical events and slowly changing dimensions.
  • Analytics marts: denormalized fact tables optimized for dashboard queries (hourly_sales_fact, stock_snapshot_fact, web_sessions_fact, order_fact).

Key modeling decisions:

  • Time-series facts with event time and load time columns to support late arriving data and reconciliation.
  • Store and SKU as primary grain for inventory and sell-through reporting.
  • Materialized hourly snapshots for stock balances to enable fast historical comparisons and YoY queries.

5. Business Metric Definitions (Examples)

We defined exactly how each KPI is calculated so reports are unambiguous:

  • Sell-through (%) = Units sold during period ÷ (Opening inventory + receipts during period) × 100.
  • Stock balance = Latest on-hand quantity per SKU per location (snapshot at defined frequency).
  • Fast movers = Top N SKUs by velocity = units_sold / days_on_shelf (configurable lookback window).
  • Hourly sales / turnover = sum(revenue) grouped by hour of transaction (store local time).
  • YoY comparisons = Align period windows and apply same business calendar and promotion normalization.
  • Sales efficiency (example) = Revenue per staffed hour or Conversion Rate = Orders / Sessions — we provide multiple definitions per stakeholder need.

6. Power BI Dashboards — Role-based Design

We built purpose-driven dashboards with the following features:

  • Controllers / Finance: revenue, margin, turnover, reconciled daily P&L, AR/AP cross-checks, audit drilldowns.
  • Merchandisers: sell-through by category/brand, assortment performance, fast-movers and slow movers, promotion lift analysis.
  • Warehouse / Logistics: current stock balances, incoming receipts, pick/pack throughput, exceptions and SLA breaches.
  • Store / Inventory teams: location-wise sell, hourly sales heatmap, replenishment suggestions.
  • Senior management: executive KPI cards (revenue, GM, YoY, top stores), trend analysis and alerts for anomalies.
  • E-commerce / Digital teams: real-time website visits, conversion funnel, channel performance and live sessions map.

Common dashboard capabilities:

  • Drilldowns and bookmarks, time period comparison toggles (YoY / MoM), store filtering, SKU search, map visualizations, exportable reports and scheduled email snapshots.
  • Alerting: threshold and anomaly alerts push to email/Teams/Slack for stockouts, sales drops, or traffic surges.

7. Data Quality, Reconciliation & Monitoring

We introduced automated checks:

  • Count checks and reconciliations (POS totals vs aggregated facts).
  • Schema validations and null checks.
  • Alerts for late data, sudden drops in event rates, or reconciliation mismatches.
  • Lineage and audit trail so every KPI can be traced back to raw events.

8. Security, Governance & Access Control

  • Row-level and object-level access controls for financial and HR data.
  • Encryption at rest and in transit, tokenized credentials for connectors.
  • Data retention policies and anonymization where required (e.g., PII in web analytics).
  • Documented metric definitions and change control for model updates.

9. Deployment, Scaling & Operations

  • Platform configured for horizontal scaling as transaction volumes grow.
  • Automated deployment (CI/CD) for pipelines and dashboard updates.
  • Operational runbooks, monitoring dashboards and on-call procedures for incident response. (We delivered these operational assets as part of the engagement.)

10. Training & Adoption

We ran role-based training sessions, created user guides and a KPI playbook so every team knows:

  • Which report to use for which decision.
  • How metrics are computed and where to drill for root cause.
  • How to subscribe to alerts and export scheduled summaries.

Business Outcomes (What the Client Gained)

  • Faster decisions — teams moved from daily/weekly static reports to sub-minute, actionable insights.
  • Reduced stockouts & overstocks — better visibility into sell-through and replenishment needs.
  • Higher conversion — digital team could act on real-time site traffic and conversion anomalies.
  • Cross-functional alignment — one source of truth reduced finger-pointing and sped up resolve time.
  • Time savings — finance and store teams cut manual reporting work and focused on analysis.
Business Outcomes

Why This Matters for Retail Senior Management

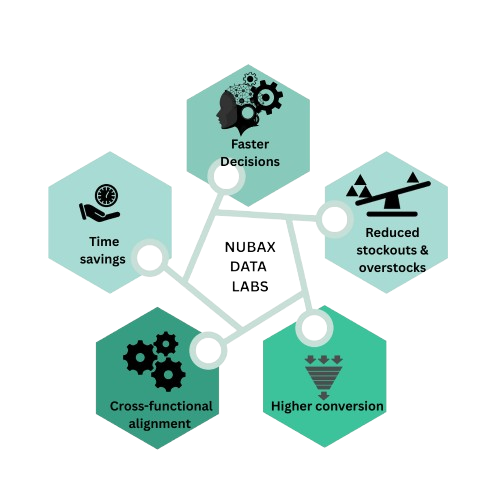
Real-time visibility turns reactive firefighting into proactive merchandising, pricing and replenishment. The investment in a governed, real-time analytics platform directly supports margin protection, improved inventory turns and better customer experience — all measurable and auditable.

How We Engage with Retail Clients

We follow a repeatable, low-risk approach:

  1. Stakeholder discovery & KPI catalog.
  2. Source inventory & proof-of-concept for critical flows.
  3. Production rollout (connectors, processing, marts).
  4. Dashboard delivery, training and handover.
  5. Operate & evolve — continuous improvement and new KPIs.

Ready to Make Your Data Work for Every Retail Decision?

If your teams struggle with stale reports, disconnected systems or poor inventory visibility, we can help assess your current landscape and show a path to real-time retail intelligence. Contact us to schedule a discovery workshop and KPI mapping session tailored to your business.