loader

Supporting Materials

KPI Catalog (Sample)

Category KPI / Metric Definition User / Team
Sales Performance Hourly Sales / Turnover Revenue by hour of transaction Store, Merchandising
Daily / Weekly Sales Total revenue & units sold Controllers, Senior Management
Year-on-Year Comparison Current vs last year same day/week Finance, Management
Inventory Stock Balances Current stock per SKU/location Warehouse, Store Ops
Sell-Through % Units sold Γ· (Opening + Receipts) Merchandising
Fast Movers Top N SKUs by velocity Merchandising, Store Ops
E-Commerce Website Visits (real-time) Active sessions on website Digital / Marketing
Conversion Rate Orders Γ· Sessions Digital, Senior Management
Efficiency Sales Efficiency Revenue per staffed hour or per visit HR, Management
Finance Gross Margin, Turnover Calculated from sales vs cost Finance, Management
Logistics Fulfillment Efficiency Orders fulfilled within SLA Logistics, Ops
HR Workforce Productivity Sales vs staff hours HR, Management

πŸ“Š Dashboard Wireframe Descriptions

Executive Dashboard
  • βœ”οΈ Revenue, YoY growth, Sell-through %, Fast movers
  • πŸ“ˆ Trend charts (daily/weekly sales)
  • πŸ—ΊοΈ Geographic map showing store performance
  • 🚨 Alerts panel for anomalies
Merchandiser Dashboard
  • πŸ“Š Category-level sell-through
  • πŸ“’ Promotion impact (lift vs baseline)
  • ⚑ Fast movers / slow movers table
  • πŸ“¦ Inventory aging by SKU
Warehouse & Logistics Dashboard
  • πŸ“¦ Stock balances by SKU/location
  • πŸ”„ Inbound vs outbound shipments
  • ⏱️ Fulfillment SLA compliance (on-time vs delayed)
  • 🚨 Exception alerts (low stock, stockout risk)
E-Commerce / Digital Dashboard
  • πŸ‘₯ Real-time website traffic (active users, sessions)
  • πŸ›’ Conversion funnel (visits β†’ cart β†’ orders)
  • πŸ“£ Channel performance (organic, ads, social)
  • πŸ’° Hourly turnover from online store
Finance Dashboard
  • πŸ“† Daily/weekly turnover and margin
  • πŸ“Š YoY comparisons with filters
  • πŸ“ˆ Cost vs revenue vs gross margin chart
  • βœ… Automated reconciliation checks
Store / Inventory Dashboard
  • πŸ”₯ Hourly sales heatmap by store
  • πŸ“ Location-wise sell-through
  • πŸ” Replenishment needs
  • πŸ‘¨β€πŸ’Ό Staff efficiency metrics

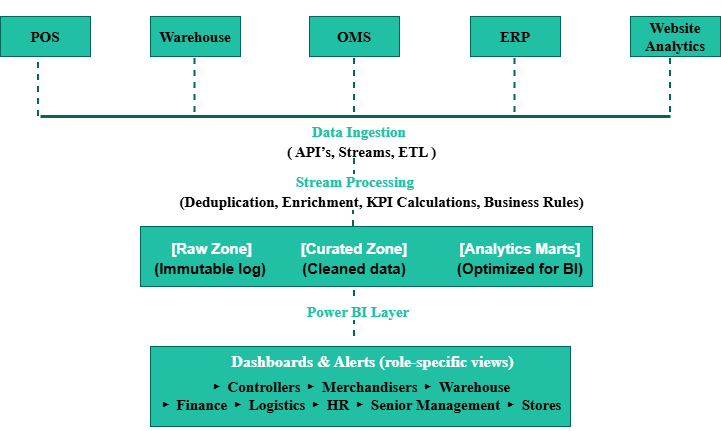
End-to-End Real-Time Retail Data Pipeline

High-Level Architecture Diagram

πŸ“Š Dashboards Tailored for Every Retail Function

Senior Management
  • πŸ’° Revenue
  • πŸ“Š YoY
  • πŸ—ΊοΈ Store Maps
  • πŸ“Œ Executive KPIs
Controllers / Finance
  • πŸ“† Turnover
  • πŸ“‰ Margins
  • πŸ” Reconciliation
  • πŸ“„ P&L
Merchandisers
  • πŸ“¦ Sell-through
  • ⚑ Fast/Slow Movers
  • πŸ“’ Promotions
  • πŸ›οΈ Assortment
Warehouse / Logistics
  • πŸ“¦ Stock Balances
  • πŸ”„ Inbound/Outbound
  • ⏱️ SLA Compliance
Store Teams
  • πŸ“ Location-wise Sales
  • πŸ”₯ Hourly Heatmaps
  • πŸ” Replenishment Alerts
E-commerce / Digital
  • πŸ‘₯ Website Visits (real-time)
  • πŸ›’ Conversion Funnel
  • πŸ“£ Channel Performance
HR / Workforce
  • πŸ‘¨β€πŸ’Ό Sales per Staff Hour
  • πŸ“ˆ Productivity Metrics